improved
More insight into Calibrations
We've just updated the Calibrations Report to include a new statistic that will help you get even more insight into how your evaluators are performing.
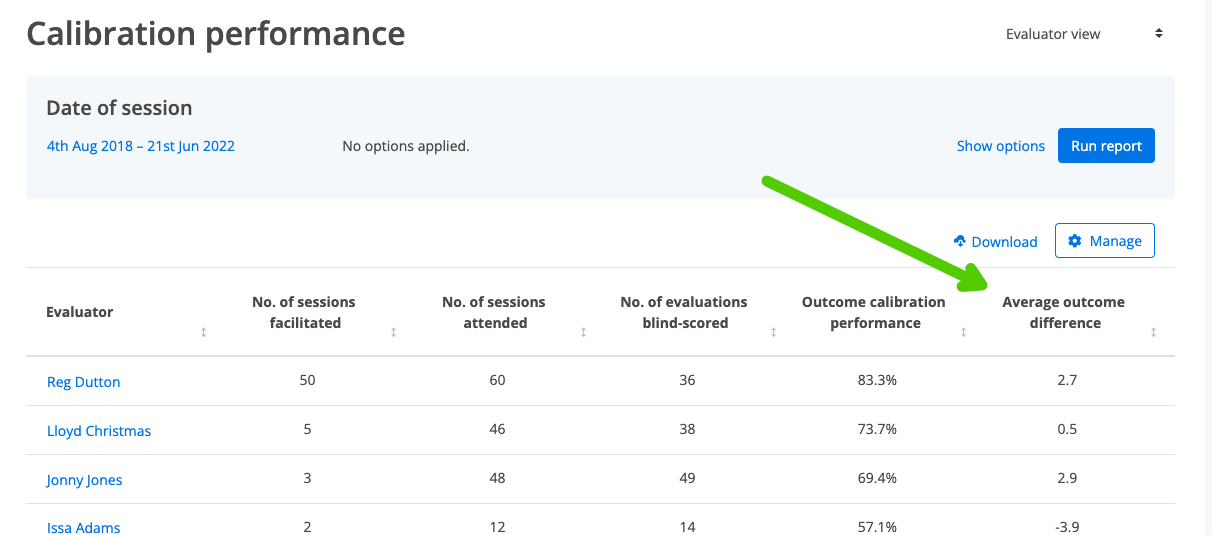
From today, you'll see the new column
Average outcome difference
in the report.
This stat takes the average evaluation outcomes in the evaluators blind sessions and compares them to the average calibrated scores. For example, a reading of 8.2 would indicate that the evaluator, on average, scores 8.2 percentage points higher than the calibration (calibrator average: 50%, evaluator average: 58.2%).
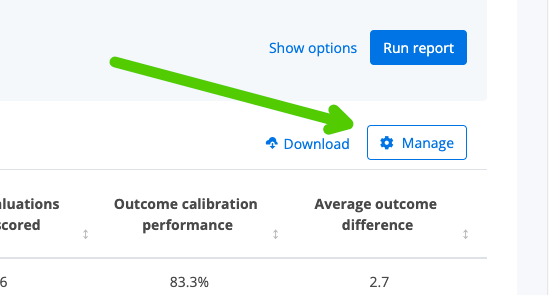
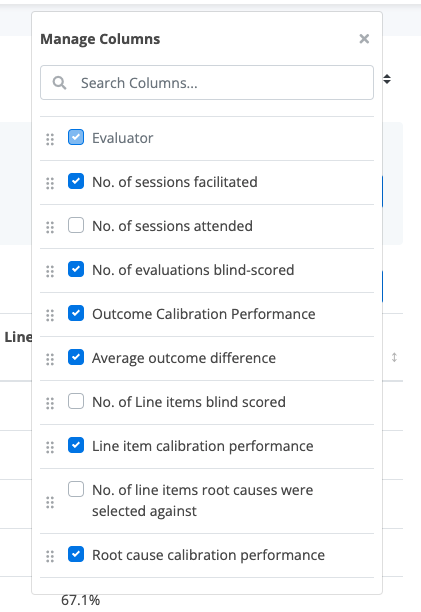
We've also added a column picker to this report, so you can remove any columns that you may not refer to:

